Project 1 - ARUNAN RABINDRAN
CS526 - Spring 2009
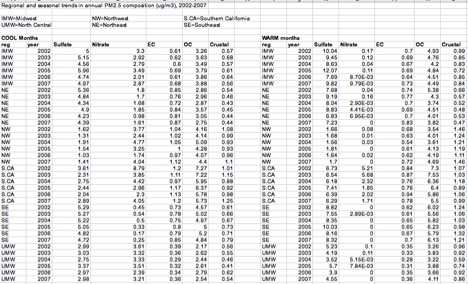
Regional & Seasonal Trends
Annual Particulate Matter (PM2.5) Composition for 2002 - 2007
Seasonal (2 seasons)
COOL MONTHS * (only COOL months has been represented)
WARM MONTHS
Regional (6 regions)
Midwest
Northwest
North Central
Northeast
Southern California
Southeast
Particulate Matter (5 pollutants)
Sulfate
Nitrate
EC (Elemental Carbon)
OC (Organic Carbon)
Crustal
Each Data-point (PM2.5 composition - ug/m3)
region/year+season/pollutant
30 data-points per season per region
60 data-points per year per region
360 data-points in all (180 per season)
From regional websites
Region 1 - New England (connecticut, maine, massachusetts, new hampshire, rhode island, vermont & 10 tribal nations
Region 2 - ?? (new jersey, new york, puerto rico, us virgin islands, seven tribal nations)
Region 3 - The Mid-Atlantic States (delaware, district of columbia, maryland, pennsylvania, virginia, west virginia)
Region 4 - Southeast (alabama, florida, georgia, kentucky, mississippi, north carolina, south carolina, tennessee and 6 tribes)
Region 5 - ?? (illinois, indiana, michigan, minnesota, ohio, wisconsin and 35 tribes)
Region 6 - ?? (arkansas, louisiana, new mexico, oklahoma, texas and 65 tribes)
Region 7 - ?? (iowa, kansas, missouri, nebraska and 9 tribal nations)
Region 8 - ?? (colorado, montana, north dakota, south dakota, utah, wyoming and 27 tribal nations)
Region 9 - Pacific Southwest (arizona, california, hawaii, nevada, pacific islands, over 140 tribal nations)
Region 10 - Pacific Northwest (alaska, idaho, oregon, washington and native tribes)
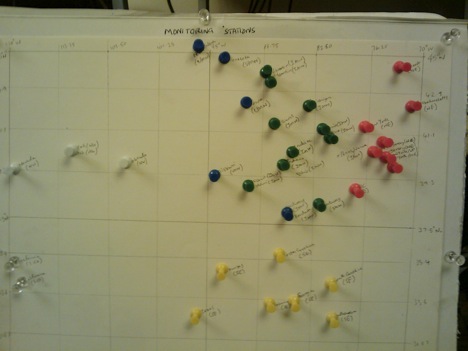
Accompanying Data Table - Showing stations
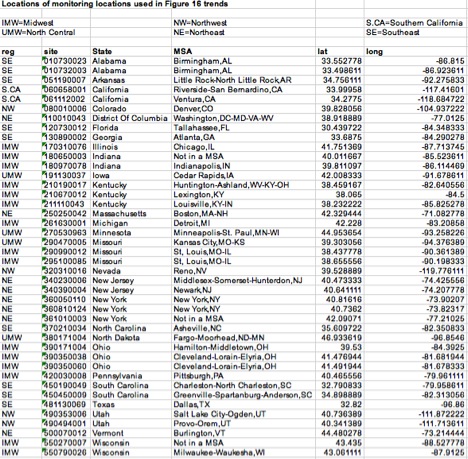
42 monitoring stations worth plotting to demarcate regions
The Visualization Model
Two charts for cool months & hot months
One chart for monitoring stations plotting
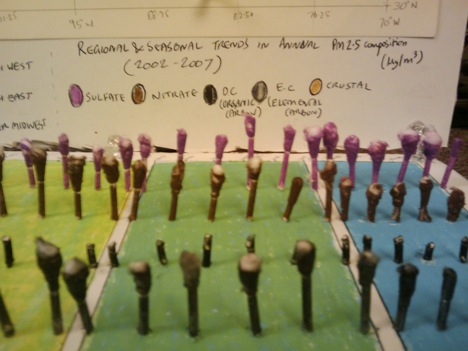
Seasonal Charts
- demarcate regions and draw square 2D map (approximated from monitoring stations plot)
- plot data points for 5 different pollutants over 6 years
- sulfate(maroon), nitrate(brown), elemental carbon(black), organic carbon(dark gray), other crustal elements(pale brown)
- height of the glyphs adjusted to represent data values for particular year for particular region
Things Used
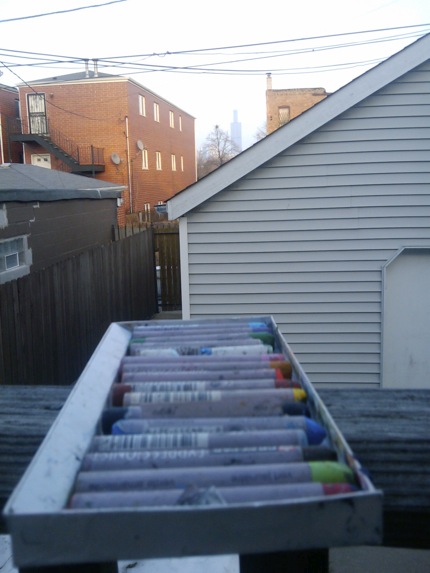
Oil Pastels
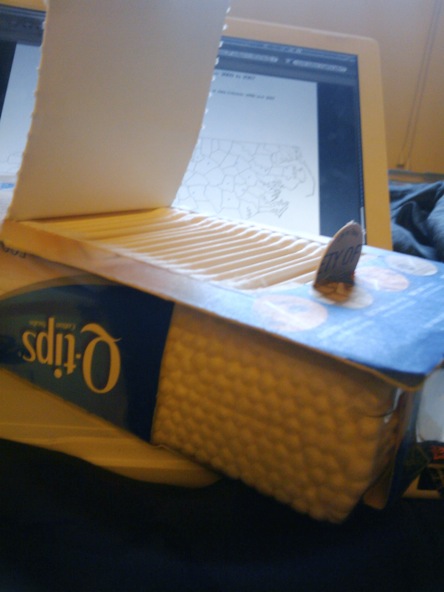
Cotton Swabs
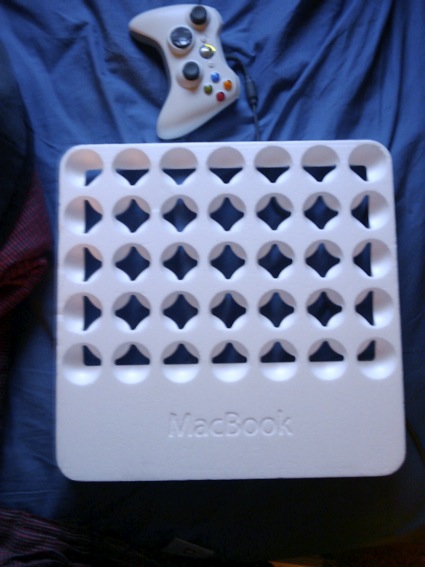
Macbook Shipping Material
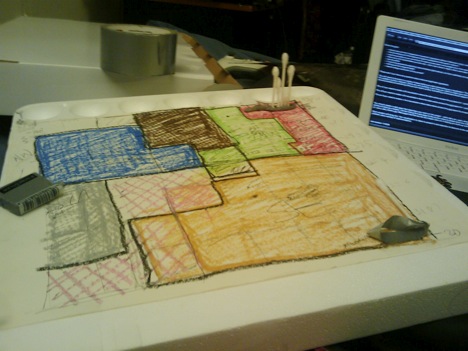
Some pushpins & Lots of krazy glue.
How it was done..
1. Plotted monitoring stations using pushpins to simplify regions to squares
2. Painted swabs the right colors for each pollutant
3. Krazy glued the swabs to the regions after cutting them to scale based on the data
4. Could see regional concentration of particulate matter based on area of the regions
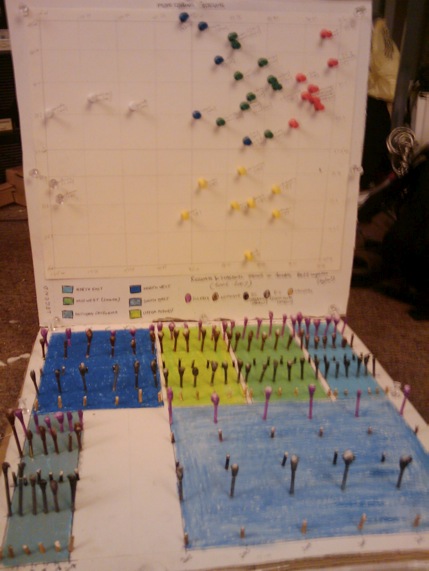
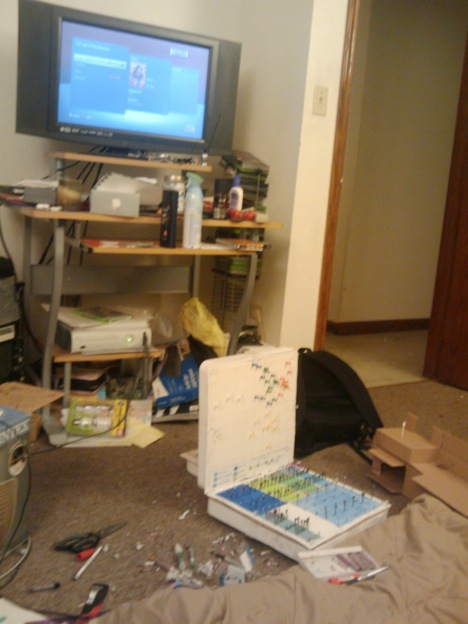
The final model..